Configuring Prometheus
RUPKKI Health Checks supports exporting metrics and check statuses to Prometheus, for use with Grafana.
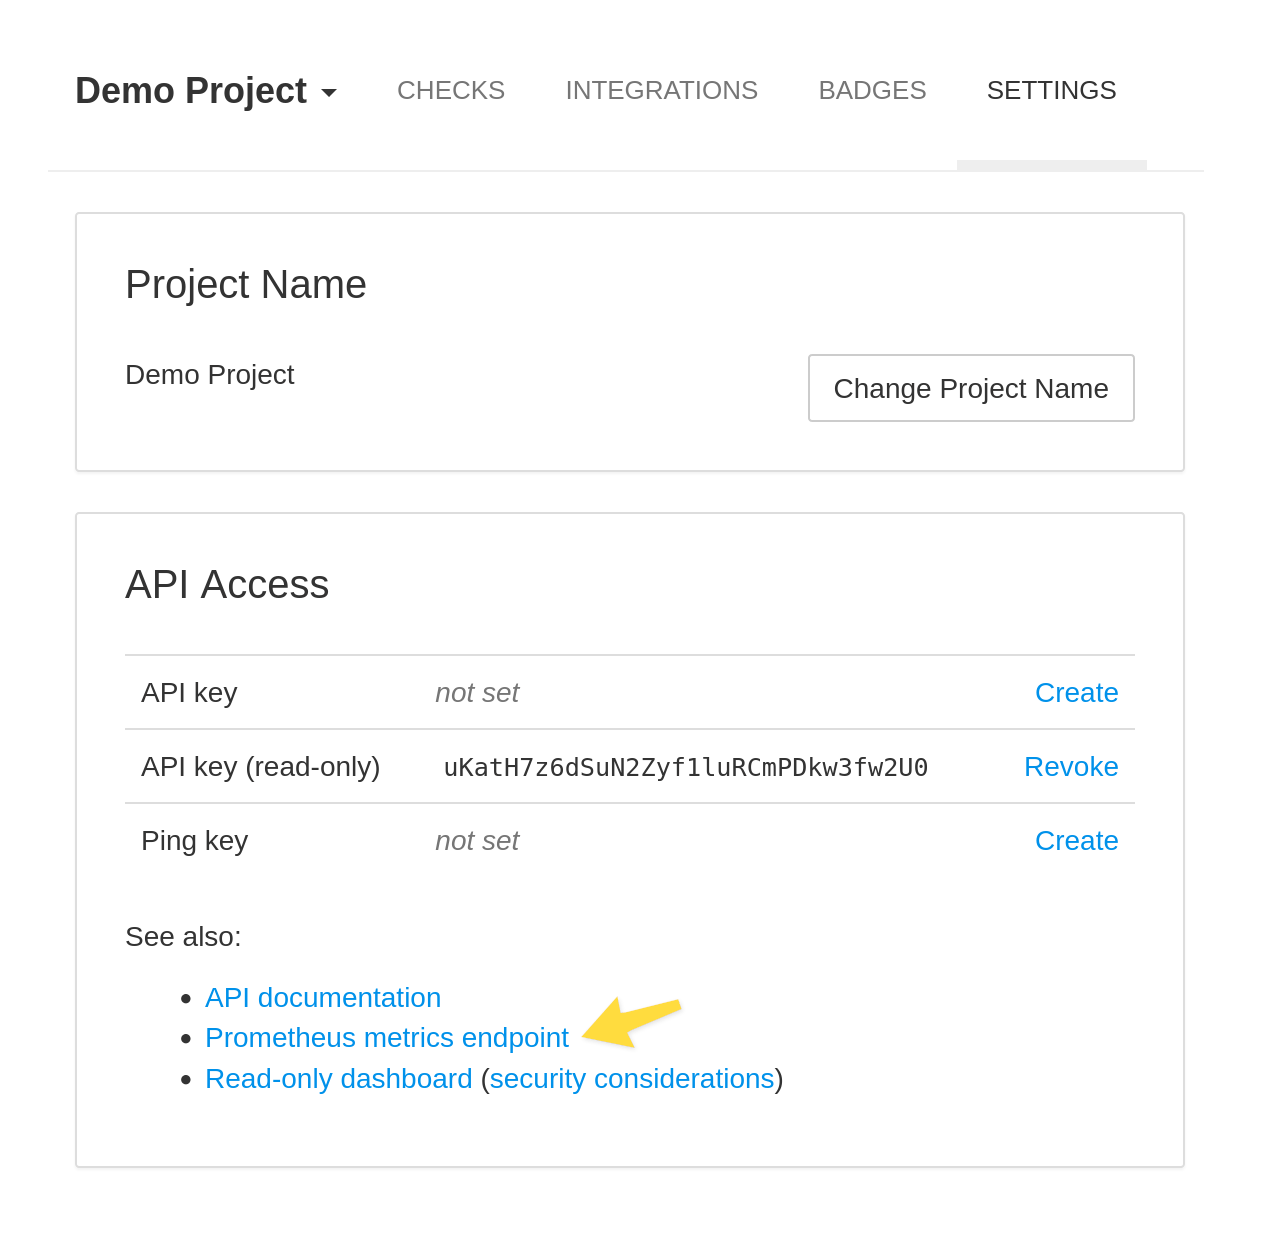
You can generate the metrics export endpoint by going to your project settings and creating a read-only API key. You will then see the link to the Prometheus endpoint:

Update the prometheus.yml
You can copy the Prometheus endpoint URL and add it to the Prometheus configuration:
  - job_name: "healthchecks"
    scrape_interval: 60s
    scheme: https
    metrics_path: /projects/45sd78-eeee-dddd-8888-b25a9887ecfd/metrics/NXyGzks4s8xcF1J-wzoaioyoqXIANGD0
    static_configs:
      - targets: ["health.rupkki.sk"]
Notice how we split up the URL and paste in the scheme, domain, and path separately.
Reload Prometheus, and your changes should be live, coming in under the hc_ prefix.